

Women in the Workforce: Breaking the Glass Ceiling in America – 2020 Study
According to 2018 Census data, women make about 80% of what men make nationwide. The average full-time female worker earned $42,295, while the average full-time male worker earned $52,144. Though this gender pay gap...Monday, March 2nd 2020, 9:11 am
By Stephanie Horan, CEPF®

According to 2018 Census data, women make about 80% of what men make nationwide. The average full-time female worker earned $42,295, while the average full-time male worker earned $52,144. Though this gender pay gap suggests differences in compensation between men and women and their ability to save, it does not distinguish between two distinct metrics: pay discrepancies between men and women who have the same job and differences in promotion rates between men and women. That is, the gender pay gap may partially be a result of the fact that men are promoted more often than women and, in turn, earn more in higher-level positions.
In this study, we investigated women’s status as managers within the private sector and the extent to which men have higher odds of promotion than women. Using data from the Equal Employment Opportunity Commission (EEOC), an independent federal agency that promotes equality through the enforcement of federal civil rights laws, we examined national, industry and geographic trends in promotion rates by sex. It is important to note that employers with fewer than 100 employees are not required to file with the EEOC, and as a result, the data used captures about half of the private sector workforce at the national level. Industry representation varies depending on the percentage of large firms in the workforce; industries comprised primarily of large firms are more fully represented than those comprised primarily of smaller firms. For further details, see our Data and Methodology section below.
Key Findings- Managerial white-collar jobs are predominantly filled by men. Though women are employed at roughly equal levels to men in entry and mid-level white-collar occupations, they fall behind as managers and officials. In 2018, for every 100 men who were managers and officials, there were only 64 women managers and officials. Moreover, there were only 45 female executive/senior-level officials and managers (a subcategory of managers and officials) for every 100 male executive/senior-level officials and managers.
- Within the private sector, the odds of promotion for men are about one and a half times higher than they are for women. Using 2018 data from the EEOC on the number of officials and managers and total white-collar workers, we found that the odds of promotion for men are about 28% compared to 18% for women.
- Women are promoted at higher rates than men in less than 10% of industries. Of the 55 industries with more than 200,000 employees reported to the EEOC, there are only five in which the odds of promotion for a woman are higher than for a man. They include motor vehicle and parts dealers; air transportation; broadcasting (except internet); performing arts, spectator sports and related industries; and couriers and messengers.
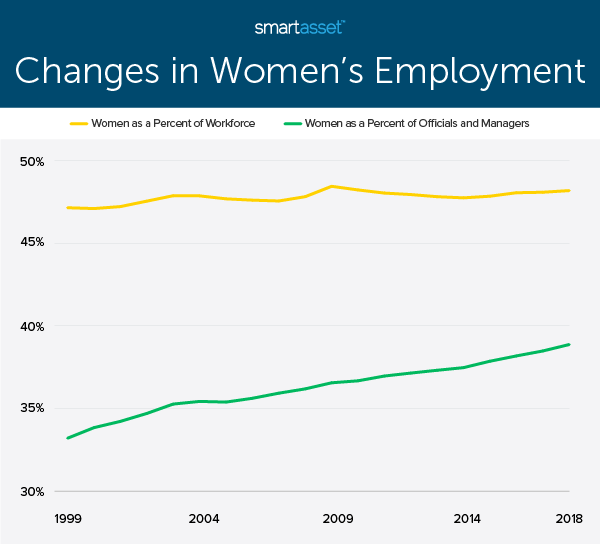
Over the past 20 years, women’s employment in the private sector has held steady, increasing by about 1% from 47.2% in 1999 to 48.2% in 2018. Though the representation of women as officials and managers has grown by almost 6% over that same time period, women still represent less than 39% of all officials and managers today. The chart below depicts changes in female employment and the percentage of women officials and managers over time.
The group of officials and managers includes two defined job categories according to the EEOC:
- Executive/senior-level officials and managers
- First/mid-level officials and managers
Though women constitute 38.9% of all officials and managers, they make up only 31.1% of the highest-ranking private sector workers, executive/senior-level officials and managers. The bar graph below shows 2018 employment of women according to all 10 EEOC job categories: executive/senior-level officials and managers, first/mid-level officials and managers, professionals, technicians, sales workers, office and clerical workers, craft workers, operatives, laborers and service workers.

Unlike their employment as officials and managers, women exceed their overall employment ratio compared to men in the remaining three white-collar job categories: professionals, technicians and sales workers. Almost 54% of professionals and sales workers were women in 2018, while about 51% of technicians were women.
Blue-collar job categories are split more strictly across gender lines than white-collar job categories. Close to 93% of craft workers – workers who are typically found in construction or natural resource extraction like mining and oil drilling – are men. Operatives (semi-skilled workers who have less training than craft workers) and laborers (manual workers with little training) also tend to be men. By contrast, office and clerical workers along with service workers are more often women. EEOC data from 2018 shows that about 73% of office and clerical workers and 61% of service workers were women.
Industry TrendsThough nationally less than 40% of officials and managers in the private sector are women, some industries employ more women managers than others. According to EEOC data, of the 55 industries with more than 200,000 employees, the percentage of officials and managers who are women ranges from almost 73% to less than 9%, as seen below.

The healthcare sector employs the highest number of women managers, both as a percentage of total officials and managers and in gross terms. In 2018, more than two-thirds of officials and managers were women in all healthcare industries: nursing and residential care facilities, social assistance, hospitals and ambulatory healthcare services. Nursing and residential care facilities had the highest percentage of women officials and managers, with about 112,000 of the total 154,911 managers being women, or approximately 72.6%.
Since many healthcare industries are large, the high percentages of women officials and managers equate to large numbers of female managers. Hospitals, ambulatory health care services and social assistance industries have the second-, fifth- and 12th-greatest number of women managers, respectively, of the 55 industries in our study.
Similar to industries with the highest percentages of women managers, industries with the lowest percentages of women managers are concentrated in a single sector: manufacturing. Two of the five industries with the lowest percentage of women managers and half of the bottom 10 are part of the manufacturing sector. The industries in the bottom 10 include primary metal manufacturing, wood product manufacturing, nonmetallic mineral product manufacturing, fabricated metal product manufacturing and machinery manufacturing. In all five of those industries, less than 20% of officials and managers are women.
Though industries in the healthcare sector have the highest percentage of women officials and managers relative to other industries, they may not necessarily promote women at equal rates to men. Healthcare industries employ higher numbers of women. In 2018, more than 78% of workers in all four healthcare industries were women. As a result, higher percentages of women managers are expected and do not alone indicate whether the glass ceiling is more penetrable in those industries relative to others.
To control for the prevalence of female workers in certain industries and measure the existence of a glass ceiling in each industry, we compared the odds of promotion for men and women. Assuming that workers would only be promoted into managerial positions from white-collar jobs, the odds of promotion for men is the number of men in managerial positions divided by the total number of men in white-collar jobs. Similarly, the odds of promotion for women is the number of women in managerial positions divided by the total number of women in white-collar jobs.
We compared those rates of promotion for men and women to find a glass ceiling ratio. The glass ceiling ratio is the odds of promotion for a woman divided by the odds of promotion for a man. A glass ceiling ratio equal to 1 means that the odds of promotion from a white-collar position into a managerial one are the same for men and women. A glass ceiling ratio greater than 1 indicates that women are more likely to be promoted into managerial positions than men, while a ratio less than 1 indicates the opposite. The table below shows the industries with the highest and lowest glass ceiling ratios.
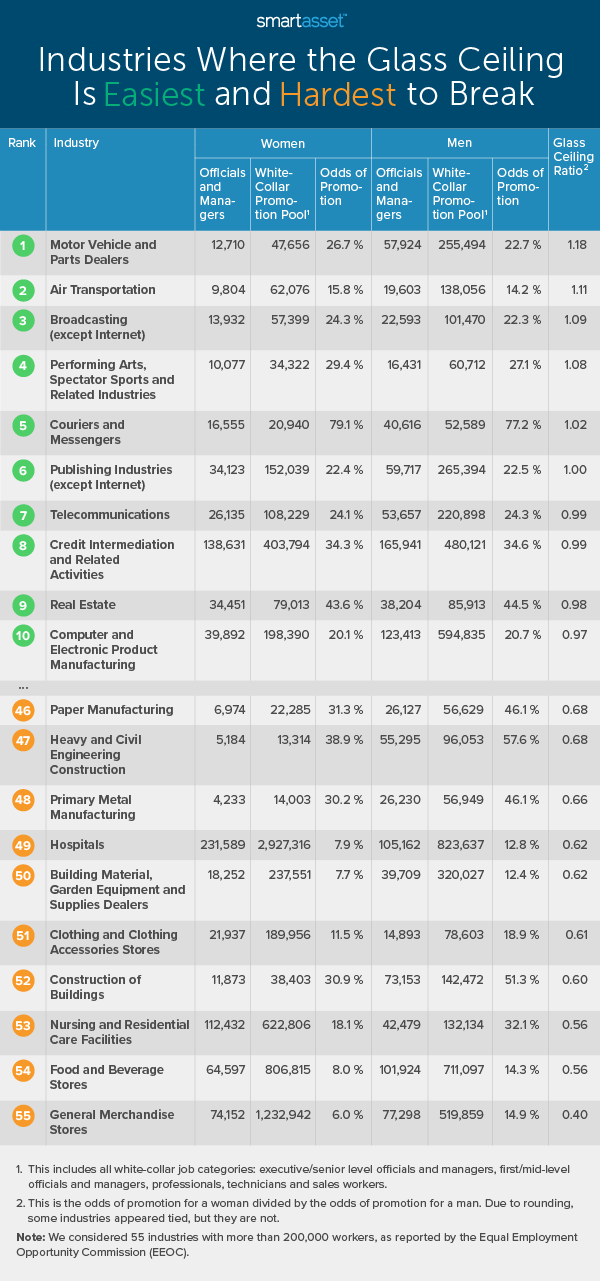
Across the 55 industries, women are promoted at higher rates than men are in only five. Those industries are motor vehicle & parts dealers; air transportation; broadcasting (except internet); performing arts, spectator sports & related industries and couriers & messengers. The industry of motor vehicle and parts dealers has the highest rate of female promotions (26.7%) relative to male promotions (22.7%). In other words, women are promoted into managerial positions 18% more often than men in this industry. Interestingly, the industry of motor vehicles and parts dealers has the ninth-lowest percentage of women officials and managers, at approximately 18%, but the low total number of women in the profession means that the odds of promotion are still high.
In contrast, though hospitals employ the third-highest number of women managers of all 55 industries, at 68.8%, they rank poorly on our glass ceiling ratio. There were almost 232,000 women managers in the hospital industry in 2018 according to the EEOC, but there were close to 3 million total women white-collar workers within the industry. This means that the odds of promotion for a woman into a managerial position is less than 8%. By contrast, the odds of promotion for a male hospital worker from a white-collar position into a managerial one is 12.8%, or more than 50% higher.
As a reminder, we use EEOC data to calculate the glass ceiling ratio in each industry and employers with fewer than 100 employees are not required to report their figures to the EEOC.
Geographic TrendsIn addition to comparing the glass ceiling ratio by industry, we considered differences across all industries for states and major metro areas. Varying glass ceiling ratios across states and metro areas may be due to differences in the predominant industries in those areas, state and local laws on sex discrimination in the workplace and cultural differences. The heat map below shows the glass ceiling ratio in each state and the District of Columbia, across all private sector industries. It is important to note that no state has a glass ceiling ratio equal to or greater than 1, meaning that in all places the odds of promotion for men are higher than the odds of promotion for women.
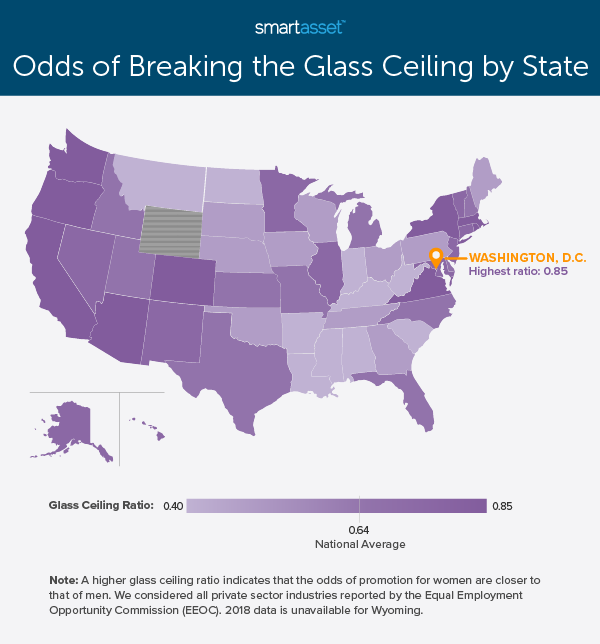
The District of Columbia has both the highest percentage of women officials and managers and the most favorable glass ceiling ratio – women are promoted at almost equal rates to men. In 2018, 49.5% of officials and managers in the nation’s capital were women. Additionally, women had a promotion rate of 24.1% relative to 28.4% for men, meaning that the glass ceiling ratio is about 0.85.
Colorado takes the second spot with a glass ceiling ratio of 0.74. Though only 38.7% of managers in Colorado were women in 2018, the odds of promotion for men and women from white-collar jobs into managerial positions did not differ greatly, as there were a smaller number of women in white-collar positions as compared to men. In 2018, the odds of promotion for a man were 24.9%, while the odds of promotion for a woman were 18.4%. If you did receive a promotion and are living in Colorado, our paycheck calculator can help you calculate your new take-home pay.
Both New York and Washington State have glass ceiling ratios of 0.73, meaning that the odds of promotion for women are about three-fourths the odds of promotion for men. There are, however, significantly more officials and managers (both men and women) in New York and they comprise a larger chunk of the white-collar workforce. In 2018, there were roughly 463,000 officials and managers in New York compared to about 142,000 in Washington State. Similarly, officials and managers make up 25% of white-collar workers in New York, while that figure is just 21% in Washington State.
In contrast to the states with the highest glass ceiling ratios, which are geographically diverse, many of the states with lower glass ceiling ratios are located in the South. Specifically, of the 10 states with the worst odds of promotion for women relative to men, seven are part of the South: Mississippi, Louisiana, West Virginia, South Carolina, Arkansas, Kentucky and Alabama. The odds of promotion for a man living in Mississippi, Louisiana and West Virginia are more than double the odds of promotion for a woman in those states.
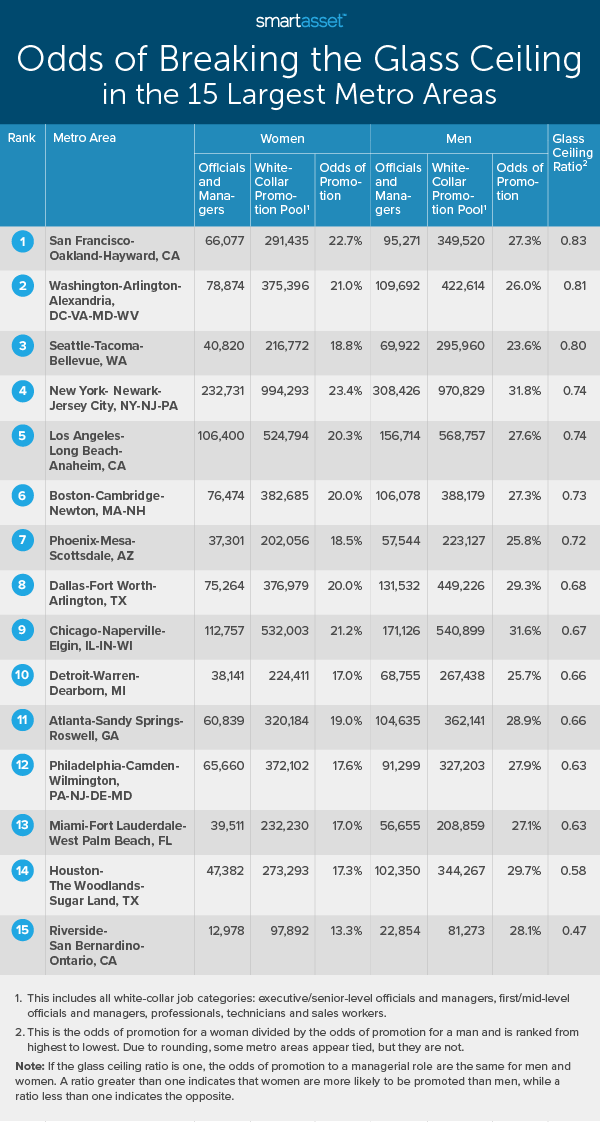
Of the top five metro areas where the odds of breaking the glass ceiling are the highest, three are located on the West Coast. They are San Francisco-Oakland-Hayward, CA; Seattle-Tacoma-Bellevue, WA and Los Angeles-Long Beach-Anaheim, CA. In all three of those metro areas, the glass ceiling ratio is greater than 0.74, or higher than the national average, 0.64, by more than 15%.
New York-Newark-Jersey City, NY-NJ-PA has the fourth-highest glass ceiling ratio, 0.74, despite having the highest percentage of women officials and managers of any of the largest 15 metro areas. Of the roughly 541,000 total officials and managers in the New York metro area in 2018, about 233,000, or more than 43%, were women. However, there were about 994,000 white-collar women workers, meaning the odds of promotion for a woman were 23.4%, compared to 31.8% for men.
Four of the 15 largest metro areas in the U.S. have glass ceiling ratios below the national average. They include Riverside-San Bernardino-Ontario, CA; Houston-The Woodlands-Sugar Land, TX; Miami-Fort Lauderdale-West Palm Beach, FL and Philadelphia-Camden-Wilmington, PA-NJ-DE-MD. Like in the bottom four states that we mentioned above, the odds of promotion for men in the Riverside metro area are more than double the odds for women.
Data and MethodologyData for this study comes from the Equal Employment Opportunity Commission (EEOC), a government agency that reports on the demographics of the American workforce according to sex and race/ethnic categories. All employers with 100 or more employees are required by law to file an Employer Information Report EEO-1 with the EEOC at the end of every fiscal year. In 2018, a total of 281,932 private industry firms reported data to the EEOC on roughly 56.1 million workers. As there are about 108 million private industry workers in the U.S., EEOC data captures about half of the private sector workforce.
For the Industry Trends section, we considered the 55 three-digit NAICS industries with more than 200,000 employees. For the Geographic Trends section, 2018 EEOC data was unavailable on Wyoming.
Tips for Making the Most of Your Promotion- Ask for a raise. There has been a rising trend of employers giving promotions without a pay raise, according to a recent survey of 300 employers by the staffing firm OfficeTeam. If you are accepting a promotion and taking on more responsibility, be sure you are asking to be compensated fairly. One of the best ways to do this is to see what other people in your occupation are making. The Bureau of Labor Statistics publishes annual employment statistics that show the average hourly and annual wage by occupation.
- Use a bump in your salary wisely. If you get a raise, think about the best way to allocate extra money you are making. Our paycheck calculator can help you calculate the difference in your take-home pay. With that difference in mind, consider adding some of the money to a savings account and take advantage of compound interest. Take a look at our investment calculator to see how your money could grow over time.
- Consider a professional advisor. A financial advisor may help you be better in control of your money. Finding the right financial advisor who fits your needs doesn’t have to be hard. SmartAsset’s free tool matches you with financial advisors in your area in five minutes. If you’re ready to be matched with local advisors that will help you achieve your financial goals, get started now.
Questions about our study? Contact us at press@smartasset.com
Photo credit: ©iStock.com/sorbetto
The post Women in the Workforce: Breaking the Glass Ceiling in America – 2020 Study appeared first on SmartAsset Blog.
Information contained on this page is provided by an independent third-party content provider. Frankly and this Site make no warranties or representations in connection therewith. If you are affiliated with this page and would like it removed please contact pressreleases@franklymedia.com

Get The Daily Update!
Be among the first to get breaking news, weather, and general news updates from News on 6 delivered right to your inbox!
More Like This


December 11th, 2024

December 11th, 2024

December 11th, 2024
Top Headlines
December 11th, 2024
December 11th, 2024

December 11th, 2024
